07. Quizzes On Scatter Plots
QUIZ QUESTION::
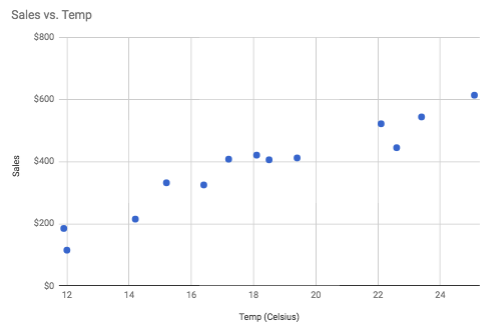
Match each term to the description that applies for the above scatterplot.
ANSWER CHOICES:
|
Term |
Description |
|---|---|
Strength |
|
Direction |
|
Correlation Coefficient |
SOLUTION:
|
Term |
Description |
|---|---|
|
Direction |
|
|
Correlation Coefficient |
|
|
Strength |
Check Your Scatterplot Skills (Part II)
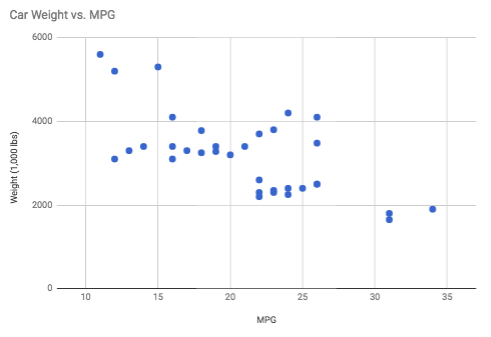
Use the scatterplot between car weight and miles per gallon to solve the matching quiz. Again, you can download the data here.
QUIZ QUESTION::
Match each term to the description that applies for the above scatterplot.
ANSWER CHOICES:
|
Term |
Description |
|---|---|
Strength |
|
Direction |
|
Correlation Coefficient |
SOLUTION:
|
Term |
Description |
|---|---|
|
Strength |
|
|
Direction |
|
|
Correlation Coefficient |
Check Your Scatterplot Skills (Part III)
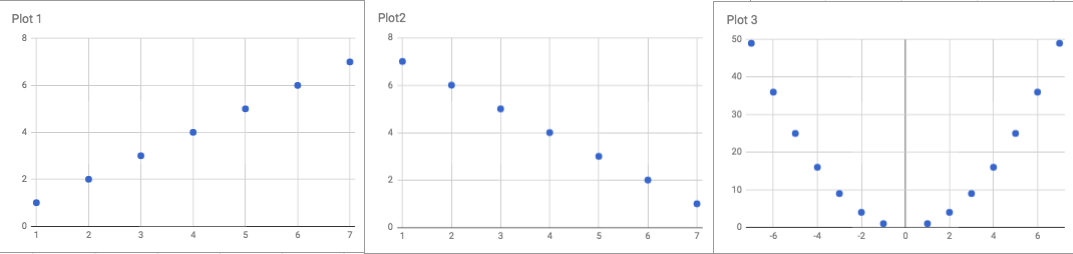
Use the scatterplots for the three datasets below to answer the following quiz. Again, you can download the data here.
QUIZ QUESTION::
For the above scatterplots, match the plot to the corresponding correlation coefficient.
ANSWER CHOICES:
|
Scatter plot |
Correlation Coefficient (r) Value |
|---|---|
Plot 1 |
|
Plot 2 |
|
Plot 3 |
SOLUTION:
|
Scatter plot |
Correlation Coefficient (r) Value |
|---|---|
|
Plot 3 |
|
|
Plot 2 |
|
|
Plot 1 |
|
|
Plot 1 |
|
|
Plot 2 |